Note
Hello, welcome to the SunFounder Raspberry Pi & Arduino & ESP32 Enthusiasts Community on Facebook! Dive deeper into Raspberry Pi, Arduino, and ESP32 with fellow enthusiasts.
Why Join?
Expert Support: Solve post-sale issues and technical challenges with help from our community and team.
Learn & Share: Exchange tips and tutorials to enhance your skills.
Exclusive Previews: Get early access to new product announcements and sneak peeks.
Special Discounts: Enjoy exclusive discounts on our newest products.
Festive Promotions and Giveaways: Take part in giveaways and holiday promotions.
👉 Ready to explore and create with us? Click [here] and join today!
2.8 Light Intensity Display
In this project, we use a photoresistor and the LED Bar Graph to make a light intensity display, where the stronger the light is the more the number of the LED Bar Graph lights up.
Required Components
In this project, we need the following components.
It’s definitely convenient to buy a whole kit, here’s the link:
Name |
ITEMS IN THIS KIT |
LINK |
|---|---|---|
Kepler Kit |
450+ |
You can also buy them separately from the links below.
SN |
COMPONENT |
QUANTITY |
LINK |
|---|---|---|---|
1 |
1 |
||
2 |
Micro USB Cable |
1 |
|
3 |
1 |
||
4 |
Several |
||
5 |
11(10-220Ω, 1-10KΩ) |
||
6 |
1 |
||
7 |
1 |
Wiring
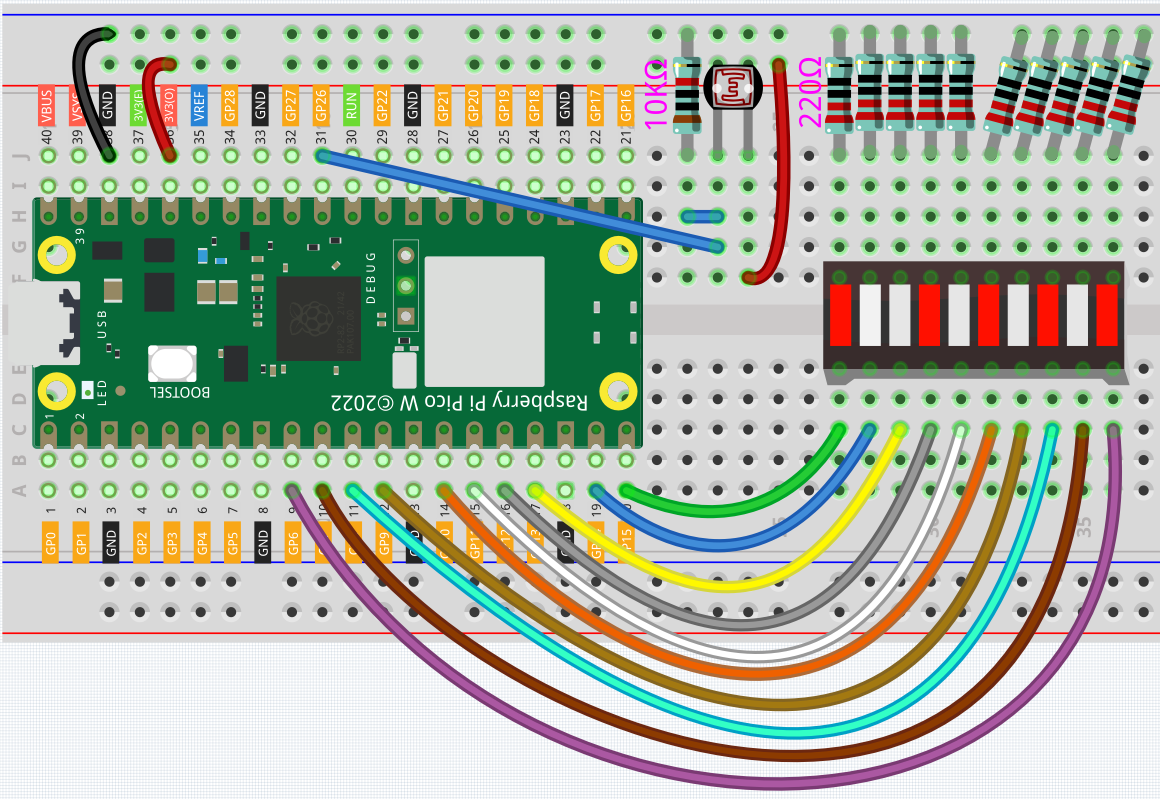
The LED Bar Graph consists of 10 LEDs, with the side with the label as the anode and the other side as the cathode.
The anode of the LED Bar Graph are connected to GP6~GP15. The cathode are connected to a 220 ohm resistor and then to GND.
Connect one end of the photoresistor to 3.3V and the other end to GP26 (A0). At the same time, GP26 needs to be connected to another 10K resistor to GND. This way, when the light is stronger, the resistance of the photoresistor decreases and the voltage of A0 increases.
Code
Note
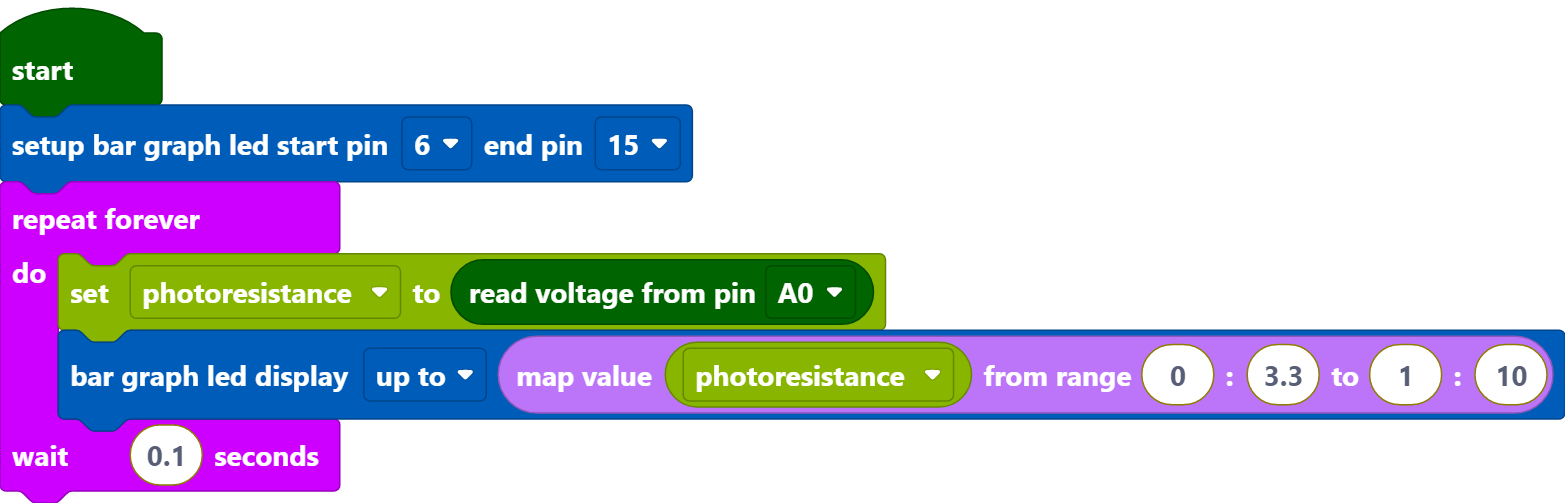
You can refer to the image below to write code by dragging and dropping.
Import
2.8_light_intensity_display.pngfrom the path ofkepler-kit-main\piper. For detailed tutorials, please refer to Import the Code.
After connecting Pico W, click the Start button and the code starts to run.
When the light is stronger, more LEDs are lit on the LED Bar Graph.
If running the code does not light up properly, you can try flipping the led bar.
How it Works?
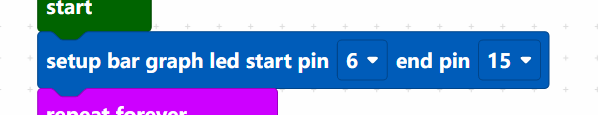
Set the pins of LED Bar Graph connected to GP6 ~ GP15.
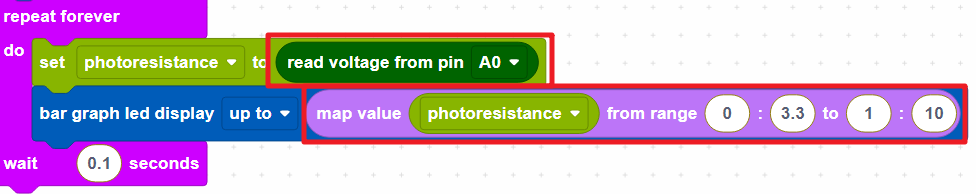
Store the voltage value of A0 (GP26) read into the variable [photo_vol]. Use the [map value () from () to ()] block to map the variable [photo_vol] from 0 to 3.3V to 0 to 10 (the number of LEDs on the LED Bar Graph).
[map value () from () to ()]: map a value from one range to another.