Note
Welcome to the SunFounder Raspberry Pi, Arduino & ESP32 Community on Facebook!
Get technical support and troubleshooting help.
Learn and share projects, tips, and tutorials.
Access early product previews and updates.
Enjoy exclusive discounts and giveaways.
👉 Join us here: [here]
View and Control from Dashboard
Once you have successfully installed the pironman5 module, the pironman5.service will start automatically upon reboot.
Now you can open the monitoring page in your browser to see the information about your Raspberry Pi, configure the RGB, etc. The page link is: http://<ip>:34001.

This page has Dashboard, History, Log, and a Settings page.

Dashboard
There are multiple cards to view the relevant status of the Raspberry Pi, including:
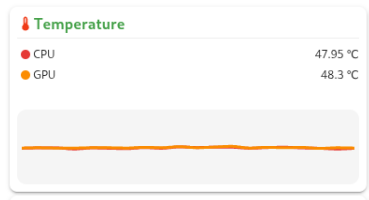
Temperature: View the Raspberry Pi’s CPU & GPU temperature.
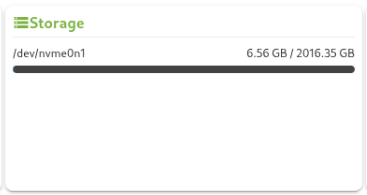
Storage: Displays the storage capacity of a Raspberry Pi, showing various disk partitions with their used and available space.
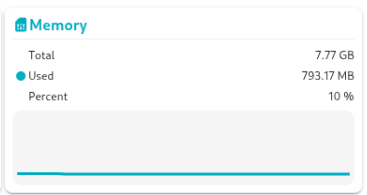
Memory: Shows the Raspberry Pi’s RAM usage and percentage.
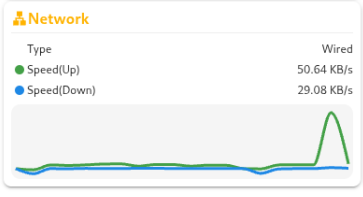
Network: Displays the current network connection type, upload, and download speeds.
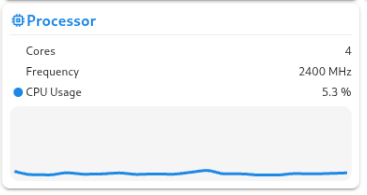
Processor: Illustrates the Raspberry Pi’s CPU performance, including the status of its four cores, operating frequencies, and CPU usage percentage.
History
The History page allows you to view historical data. Check the data you want to view in the left sidebar, then select the time range to see the data for that period, and you can also click to download it.


Log
The Log page is used to view the logs of the currently running Pironman5 service. The Pironman5 service includes multiple sub-services, each with its own log. Select the log you want to view, and you can see the log data on the right. If it is blank, it may mean there is no log content.
Each log has a fixed size of 10MB. When it exceeds this size, a second log will be created.
The number of logs for the same service is limited to 10. If the number exceeds this limit, the oldest log will be automatically deleted.
There are filter tools above the log area on the right. You can select the log level, filter by keywords, and use several convenient tools, including Line Wrap, Auto Scroll and Auto Update.
Logs can also be downloaded locally.


Settings
There is a settings menu in the upper right corner of the page where you can customize the settings according to your preferences. After making modifications, the changes will be saved automatically. If needed, you can click the CLEAR button at the bottom to clear the historical data.

Dark Mode: Toggle between light and dark mode themes. The theme option is saved in the browser cache. Changing the browser or clearing the cache will revert to the default light theme.
Show Unmounted Disk: Whether to show unmounted disks in the dashboard.
Show All Cores: Whether to show all cores in the dashboard.
Card layout: Set the card layout of the dashboard.
Temperature Unit: Set the temperature unit displayed by the system.
About OLED Screen

OLED Enable: Whether to enable OLED.
OLED Rotation: Set OLED rotation.
OLED Sleep Timeout: Set OLED sleep timeout.
OLED Page: Set the OLED page to display: System Mix, Performance Metrics, Disk Usage, IP Addresses.
About RGB LEDs

RGB Enable: Whether to enable RGB LEDS
RGB Color: Set the color of the RGB LEDs.
RGB Brightness: You can adjust the brightness of the RGB LEDs with a slider.
RGB Style: Choose the RGB LEDs display mode. Options include Solid, Breathing, Flow, Flow_reverse, Rainbow, Rainbow Reverse, and Hue Cycle.
RGB Speed: Set the speed of the RGB LED changes.
RGB Led: Set the number of RGB LEDs to control.
About Data

Debug Level: Set the debug level. Options include Info, Warning, Error, and Critical.
History Retention: Set the number of days to retain historical data.
Clear All Data: Clear all historical data.
Reboot: Reboot the system.
Shutdown: Shutdown the system.
Restart service: Restart the system services.
Fan
These fans connects to a dedicated 4-pin PWM fan port on the Raspberry Pi 5. Its default control strategy is a firmware-managed, multi-level intelligent speed adjustment scheme based on CPU temperature. This means that when you use an official or compatible PWM fan and connect it correctly, the system will automatically adjust the fan speed according to changes in CPU temperature (starting to operate above 50°C) without any manual intervention from you.