Note
Welcome to the SunFounder Raspberry Pi, Arduino & ESP32 Community on Facebook!
Get technical support and troubleshooting help.
Learn and share projects, tips, and tutorials.
Access early product previews and updates.
Enjoy exclusive discounts and giveaways.
👉 Join us here: [here]
View and Control from Dashboard
Once you have successfully installed the pironman5 module, the pironman5.service will start automatically upon reboot.
Now you can open the monitoring page in your browser to see the information about your Raspberry Pi, configure the RGB, and control the fan, etc. The page link is: http://<ip>:34001.
This page has Dashboard, History, Log, and a Settings page.
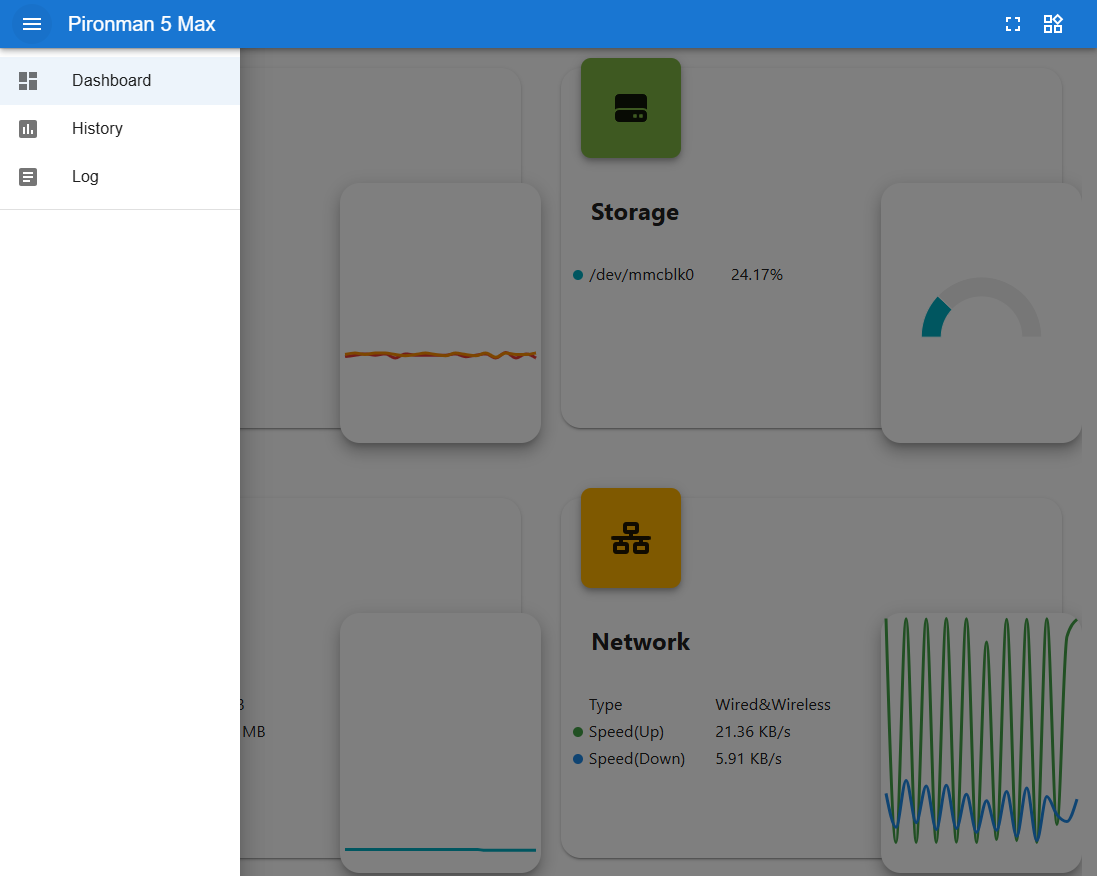
Dashboard
There are multiple cards to view the relevant status of the Raspberry Pi, including:
Temperature: View the Raspberry Pi’s CPU/GPU temperature and CPU fan speed. GPIO Fan State shows the status of the two side GPIO Fans.

Storage: Displays the storage capacity of a Raspberry Pi, showing various disk partitions with their used and available space.

Memory: Shows the Raspberry Pi’s RAM usage and percentage.

Network: Displays the current network connection type, upload, and download speeds.

Processor: Illustrates the Raspberry Pi’s CPU performance, including the status of its four cores, operating frequencies, and CPU usage percentage.

History
The History page allows you to view historical data. Check the data you want to view in the left sidebar, then select the time range to see the data for that period, and you can also click to download it.


Log
The Log page displays the runtime log of the Pironman5 service.
Log entries can be filtered by level (Debug, Info, Warning, Error, or Critical).
The log file can also be downloaded locally.

Settings
The Settings page allows you to customize the Dashboard display, system preferences, OLED screen, RGB lighting, and fan behavior. It also shows basic network information such as the MAC address and IP address.

Interface
Configure the Dashboard appearance and display behavior.

Dark mode: Enable or disable the dark theme.
Show unmounted disk: Display unmounted storage devices on the Storage card.
Show all cores: Display all CPU cores on the Processor card.
Card layout: Customize the Dashboard card layout.
Temperature Unit: Switch between Celsius and Fahrenheit.
Web UI Version: Displays the current Dashboard version.
OLED
Configure the OLED screen display and behavior.

OLED Enable: Enable or disable the OLED screen.
OLED Rotation: Rotate the OLED display between
0°and180°.OLED Sleep Timeout: Set how long the OLED screen stays on before turning off automatically.
OLED Pages: Configure which pages are displayed on the OLED screen and adjust their display order.
Available pages include:
IP Addresses: Displays IP addresses for all physical network interfaces.
Disk Usage: Displays disk usage information for all disks.
Performance Metrics: Displays CPU usage, CPU temperature, RAM usage, and fan speed.
System Mix: Displays CPU usage, CPU temperature, and IP address.
RGB
Configure the RGB LED lighting effects and behavior.

RGB Enable: Enable or disable the RGB LEDs.
RGB Color: Set the RGB LED color.
RGB Brightness: Adjust the RGB LED brightness.
RGB Style: Select the RGB lighting effect, including
None,Solid,Breathing,Flow,Flow Reverse,Rainbow,Rainbow Reverse, andHue Cycle.RGB Speed: Adjust the animation speed of the selected RGB effect.
RGB Led: Set the number of active RGB LEDs.
GPIO Fans
Configure the operating mode and LED behavior of the two GPIO Fans.

Fan LED
Control the RGB lighting behavior of the GPIO Fans.
ON: Fan LEDs always stay on.
OFF: Fan LEDs remain off.
FOLLOW: Fan LEDs follow the system RGB lighting effects.
GPIO Fan Mode
The selected mode determines when the GPIO Fans will activate.
Quiet: The GPIO Fans activate at 70°C.
Balanced: The GPIO Fans activate at 67.5°C.
Cool: The GPIO Fans activate at 60°C.
Performance: The GPIO Fans activate at 50°C.
Always On: The GPIO Fans always remain active.
System
Configure system behavior and view device information.

Debug Level: Set the logging level of the Pironman 5 service.
Mac Address: Displays the MAC addresses of the Raspberry Pi network interfaces.
IP Address: Displays the IP addresses of the Raspberry Pi network interfaces.
History Retention: Set how many days historical data will be stored.
Clear All Data: Clear all recorded history data.
Reboot: Reboot the Raspberry Pi remotely from the Dashboard.
Shutdown: Safely shut down the Raspberry Pi remotely from the Dashboard.