Note
Hello, welcome to the SunFounder Raspberry Pi & Arduino & ESP32 Enthusiasts Community on Facebook! Dive deeper into Raspberry Pi, Arduino, and ESP32 with fellow enthusiasts.
Why Join?
Expert Support: Solve post-sale issues and technical challenges with help from our community and team.
Learn & Share: Exchange tips and tutorials to enhance your skills.
Exclusive Previews: Get early access to new product announcements and sneak peeks.
Special Discounts: Enjoy exclusive discounts on our newest products.
Festive Promotions and Giveaways: Take part in giveaways and holiday promotions.
👉 Ready to explore and create with us? Click [here] and join today!
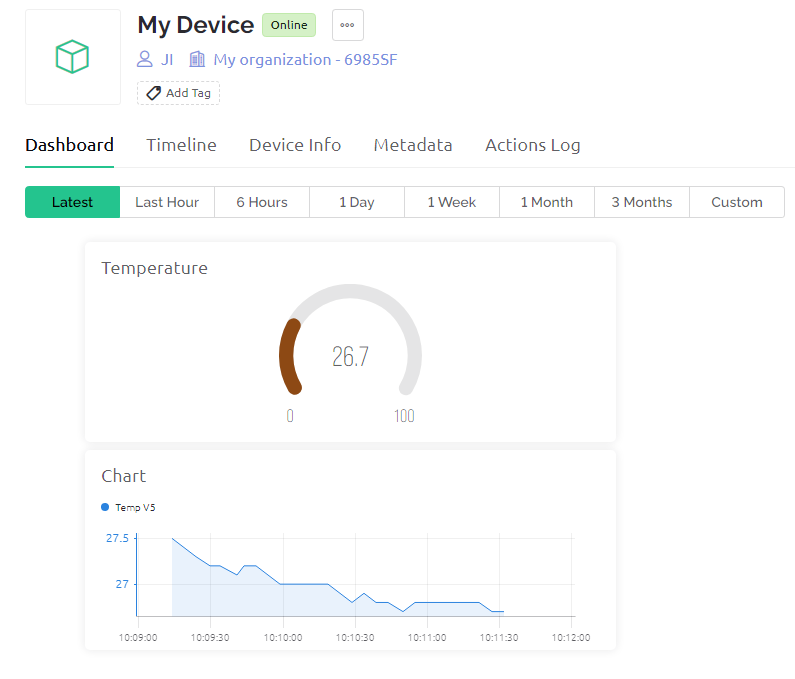
Temperature Recorder
In this project, you can see the current temperature and the temperature change line graph from Blynk.
Note
Before starting this project, we recommend that you complete Get Start with Blynk. The following will give you a clear understanding of Blynk.
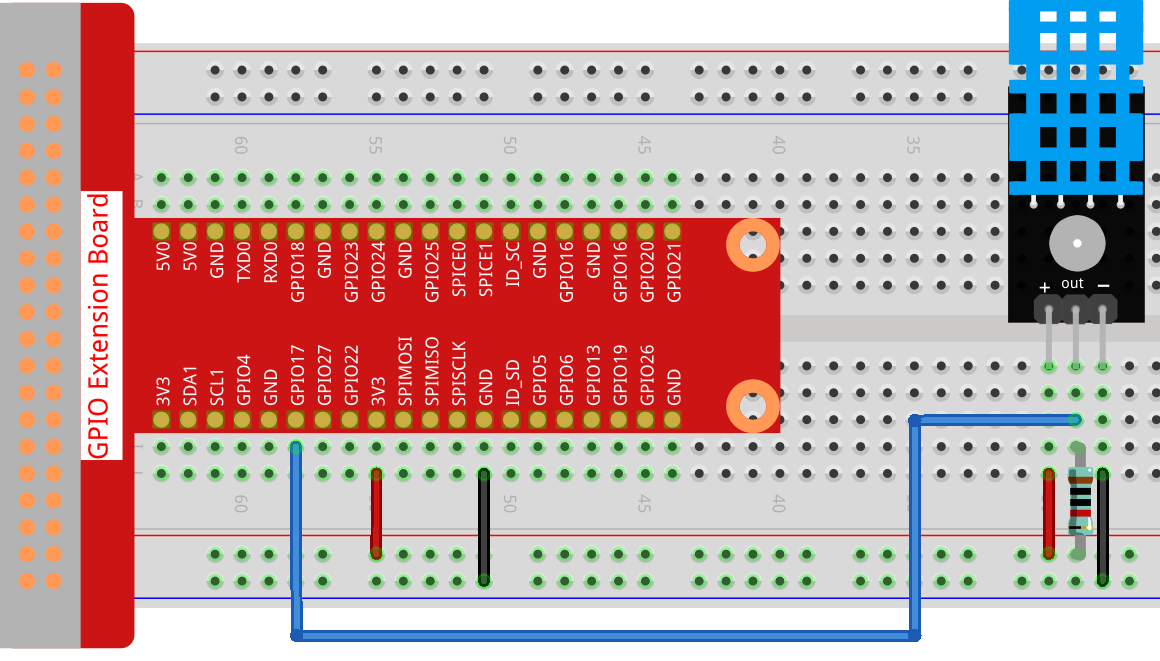
1. Wiring
2. Create Widget and Datastream
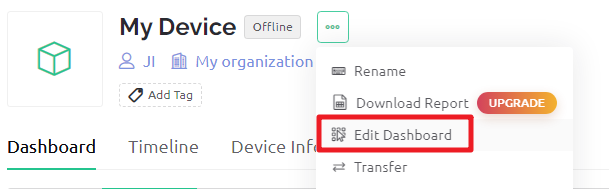
Click on the menu icon in the upper right corner and select edit dashboard.
Add a Gauge widget and a Chart widget to the Dashboard.
Create a Datastream for the Gauge widget (I used V5). It will be used to display the temperature. Set DATA TYPE to
Double, DECIMALS to#. #(two valid decimal places).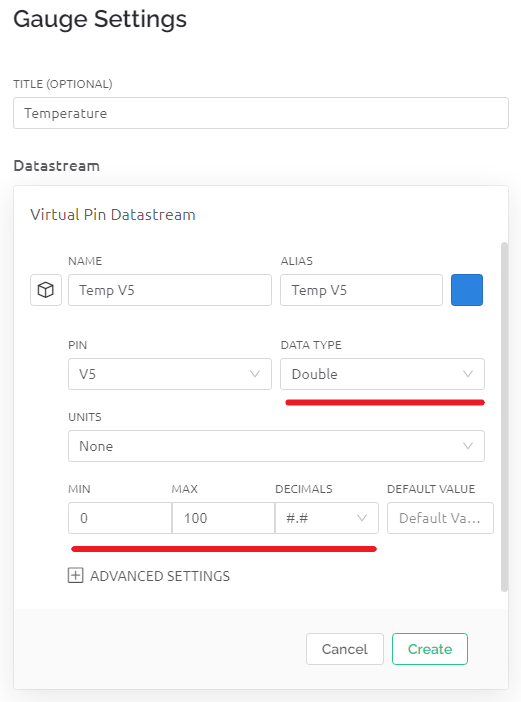
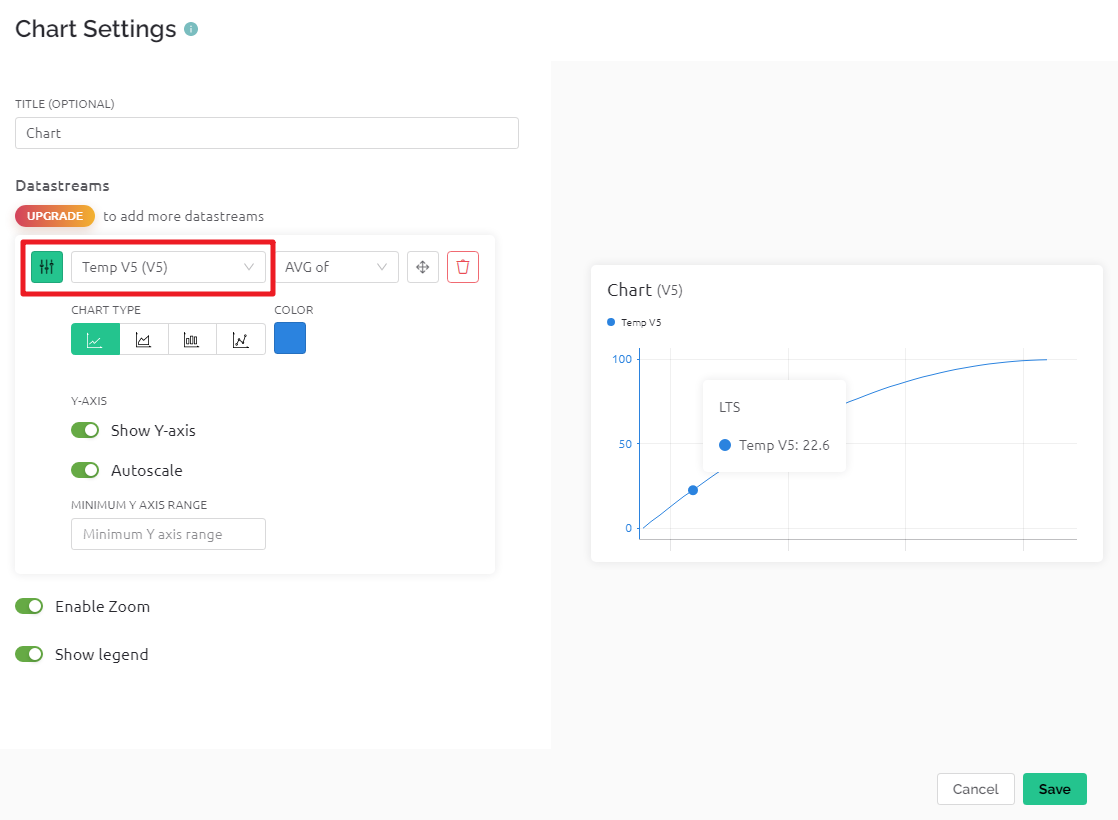
Add the V5 Datastream you just created to the Chart widget.
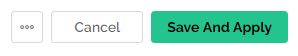
When finished, click Save And Apply at the top right.
3. Run the Code
Edit the code
cd /home/pi/blynk-raspberrypi-python
sudo nano blynk_temp.py
Find the line below and past your
BLYNK_AUTH_TOKEN.
BLYNK_AUTH = 'YourAuthToken'
Run the code.
sudo python3 blynk_temp.py
Go to Blynk. Now you can view the temperature and temperature change line graph on the Dashboard.