Hello Matrix
In this project, you will learn how to make RGB Matix HAT display different patterns and characters in different colors.
Run the code
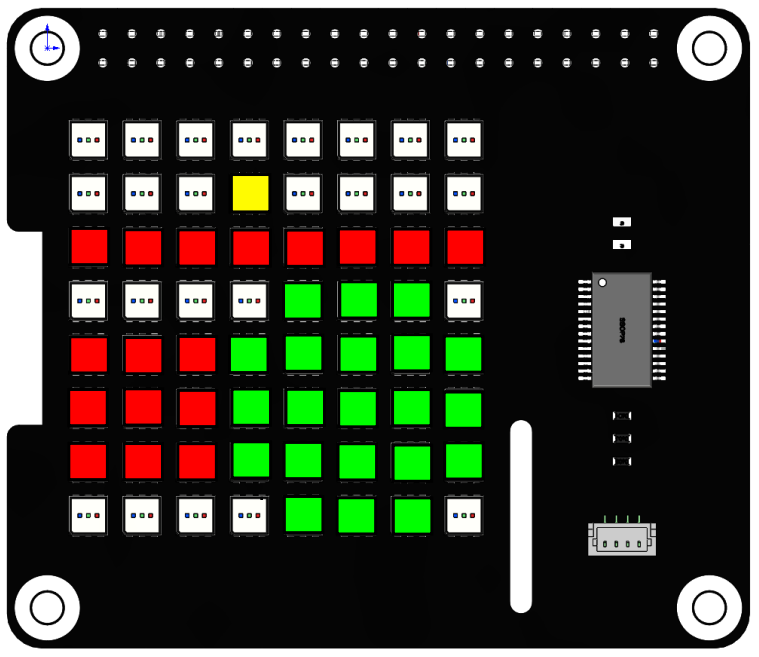
When the program runs, you will see a point, a line, a rectangle, an ellipse, and the text ‘Hi, SunFounder’ appears on the RGB Matrix HAT in turn.
cd /home/pi/rgb_matrix/raspberrypi
sudo python3 hello_matrix.py
Code
Note
You can Modify/Reset/Copy/Run/Stop the code below. But before that, you need to go to source code path like rgb_matrix/raspberrypi. After modifying the code, you can run it directly to see the effect.
from rgb_matrix import RGB_Matrix
import time

rr = RGB_Matrix(0x74)                     # create an RGB_Matrix object

point_coor = [3,1]
rr.draw_point(point_coor,fill=(255,255,0))   #draw a point
rr.display()
time.sleep(3)

line_coor = [0,2,7,2]
rr.draw_line(line_coor,fill=(255,0,0))  # draw a line
rr.display()
time.sleep(3)

rectangle_coor = [0,4,2,6]
rr.draw_rectangle(rectangle_coor,fill=(255,0,0))   #draw a rectangle
rr.display()
time.sleep(3)

ellipse_coor = [5,5]
radius = 2
rr.draw_ellipse(ellipse_coor,radius,fill=(0,255,0))   #draw a ellipse
rr.display()  #display the picture which you draw
time.sleep(3)

text = 'Hi, SunFounder'
rr.show_text(text, delay=200,color=(0,0,255))   # show text
rr.display()
time.sleep(4)
How it works?
from rgb_matrix import RGB_Matrix

rr = RGB_Matrix(0x74)
Import the RGB_Matrix class, and then create its object rr for us to call its class member functions.
point_coor = [3,1]
rr.draw_point(point_coor,fill=(255,255,0))   #draw a point
rr.display()
time.sleep(3)
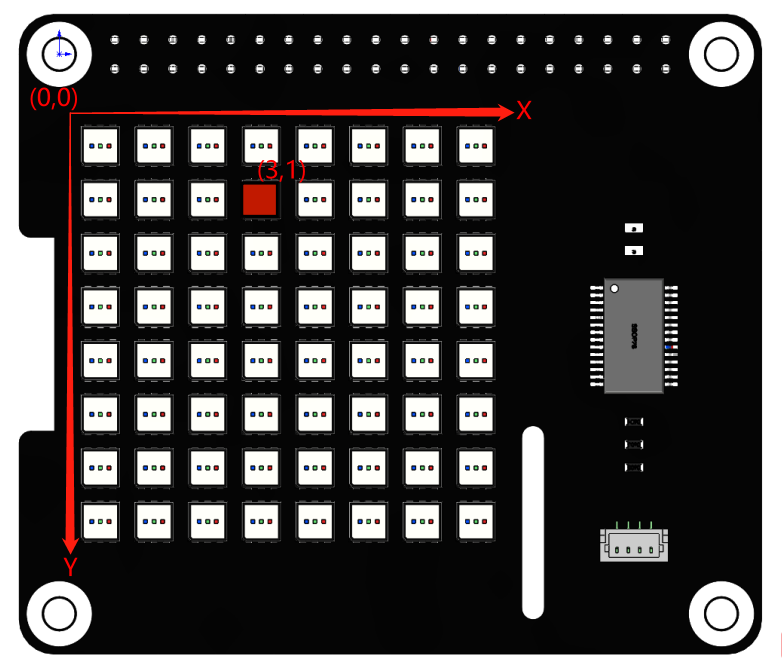
The above code is to display a yellow dot on the (3,1) coordinate of the RGB dot matrix.
draw_point() is a function that draws a point with 2 parameters: the first parameter is the coordinate on the RGB Matrix HAT, and the second parameter sets the color for the point.
The x,y coordinate directions of the dot matrix are as follows, with the first RGB LED in the upper left corner as the coordinate origin.
The fill tuple contains three elements R, G and B (red, green and blue) in the range 0-255. For example, when fill=(255,0,0), red is displayed. Refer to: https://www.rapidtables.com/web/color/RGB_Color.html for more color value combinations.
Once the coordinate and color are determined, the display() function is called to implement on the RGB dot matrix HAT.
line_coor = [0,2,7,2]
rr.draw_line(line_coor,fill=(255,0,0))  # draw a line
rr.display()
time.sleep(3)
The above code draws a red line starting at coordinate (0,2) and ending at (7,2).
draw_line() is a line drawing function, line_coor=[0,2,7,2] stores the coordinates of the start and end of the line (2 points determine a line). fill=(255,0,0) represents the line color is red.
rectangle_coor = [0,4,2,6]
rr.draw_rectangle(rectangle_coor,fill=(255,0,0))   #draw a rectangle
rr.display()
time.sleep(3)
The above code draws a red rectangle with coordinates (0, 4) and coordinates (2, 6) as diagonal coordinates.
draw_rectangle() is a function that draws a rectangle. The list rectangle_coor = [0,4,2,6] represents the two diagonal coordinates of the rectangle (0,4) and (2,6). The fill=(255,0,0) indicates that the rectangle color is red.
ellipse_coor = [5,5]
radius = 2
rr.draw_ellipse(ellipse_coor,radius,fill=(0,255,0))   #draw a ellipse
rr.display()  #display the picture which you draw
time.sleep(3)
The above code draws a green circle with the coordinates (5,5) as the center and a radius of 2.
draw_ellipse() is a function that draws a circle with three arguments that determine the center, radius and color of the circle.
text = 'Hi, SunFounder'
rr.show_text(text, delay=200,color=(0,0,255))   # show text
rr.display()
time.sleep(4)
The above code is to move and display ‘Hi, SunFounder’ on the RGB Matrix HAT.
show_text() is used to display text information, text represents the string to be displayed, delay represents the moving time, the larger the value, the slower the text moving speed.